After some
sample preparation, the direction (declination, inclination) and intensity of the samples magnetic
remanence is measured in the laboratory with a magnetometer.
Several
samples are measured from one archaeological artefact, in order to
obtain a well defined mean and its error.
The following example
is taken
from Kovacheva
et al. (2004) and concerns a more or less
circular pottery kiln
from Reinach (Switzerland) consisting of large stones lined with clay.
As stones are
not suitable for archaeomagnetic dating, the baked clay lining the kiln
walls was sampled. The archaeological age proposed by context
dating is
the second half of the 8th century AD.
The measured average direction of the remanence at the archaeological
site is:
- Inclination: I =
71.2°
- Declination: D =
10.2°
- α95
= 2.6°
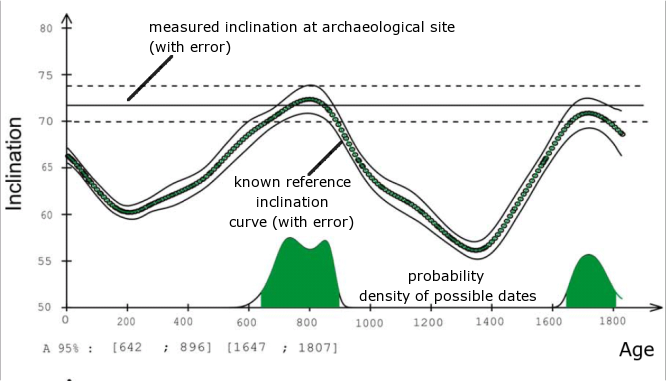
Figures C and D: Inclination and
declination plots versus time. The solid horizontal lines in both
diagrams represent measured inclination and declination of the
archaeological site of unknown age. The dashed horizontal lines are the
error of the measurement. The inclination and the declination of the
reference curve (= known time variation of D and I of the Earth's
magnetic
field) is plotted as well, together with its error. The green shaded
areas correspond to the probability densities at a 95% confidence
level of possible dates.
Figure. C: Inclination plot. The
measured inclination meets the reference inclination curve 2 times
and would suggest two possible age intervals 642-896 and 1647-1807 AD
(green shaded intervals).
(modified from Kovacheva et al., 2004)
Figure D: Declination plot. The
measured
declination, meets the reference declination curve also two times,
suggesting two different possible age intervals 774-932 and
1042-1618 (green shaded intervals). In order to obtain the most
probable solution,
the probability densities of inclination and declination are combined,
see Fig. E.

(modified from Kovacheva et al., 2004)
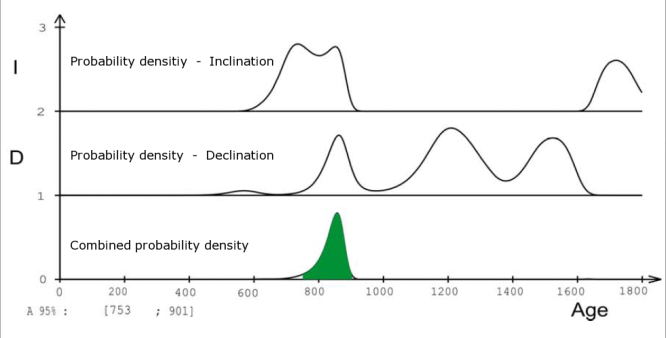
Figure E: Age
probability density of inclination (top) and declination (middle) and
their
combination (bottom). When both probability densities are
combined, the only possible age interval is: 753 - 901 AD, which is
comparable with the archaeological age (2nd
half of th the 8th century AD).
(modified from Kovacheva et al., 2004)
In case that the
archaeointensity of the site has also been
determined, it can be used as the third geomagnetic element in the same
way as it has been demonstrated here for declination and inclination.
Such dating examples, using declination, inclination and
intensity, can be found in Kovacheva
et al. (2004).
Reference
Kovacheva, M.,
Hedley, I., Jordanova N., Kostadinova, M. and V. Gigov, Archaeomagnetic
dating of archaeological sites from Switzerland and Bulgaria, Journal of Archaeological Science, 31,
1463-1479, 2004.